Best practice - Automated testing using browser plugins
ARC Toolkit
Install Arc Toolkit from the Chrome Web Store.
The ARC Toolkit runs from the Chrome DevTools panel. Use
CMD + SHIFT + C
to open the Chrome Dev Tools. Alternatively you can right click on the page and choose ‘Inspect’.
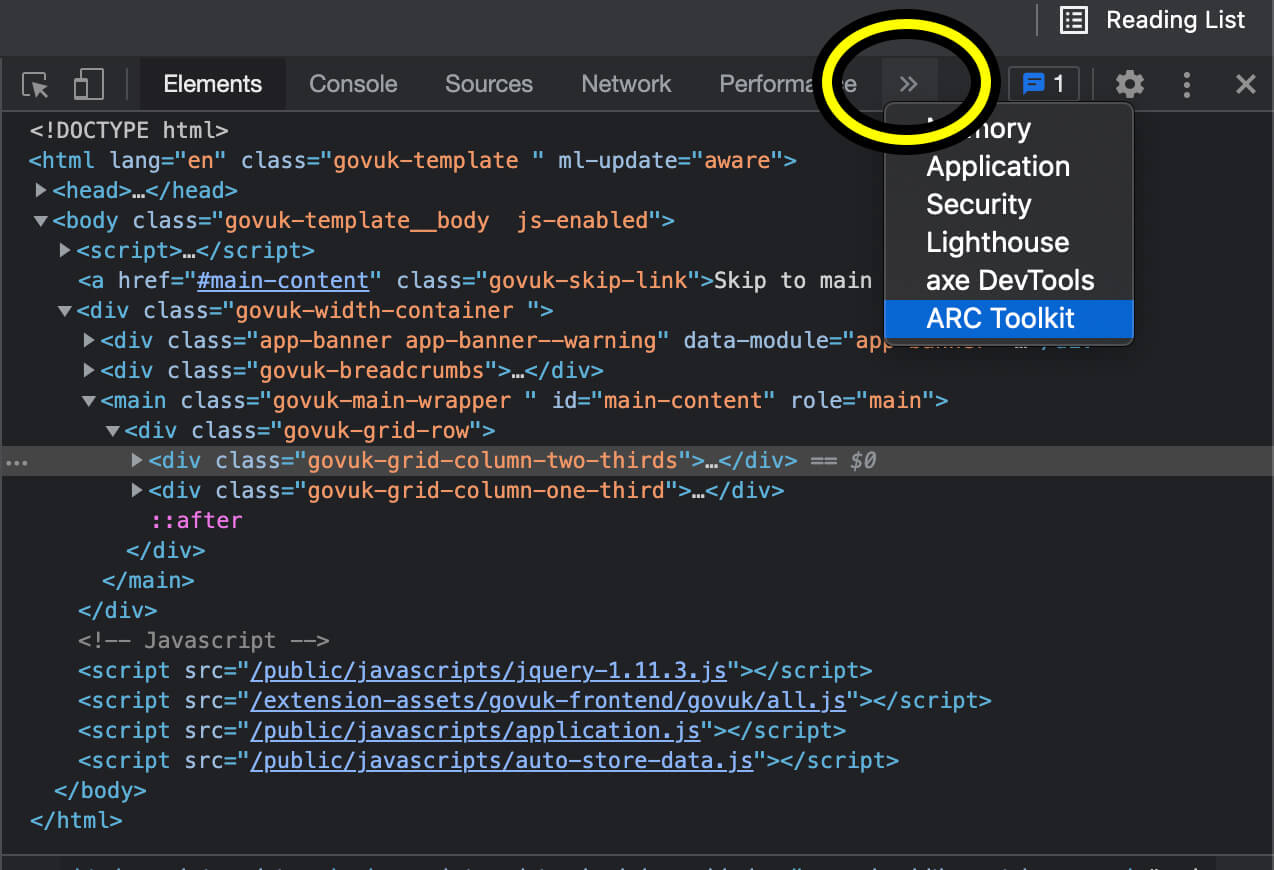
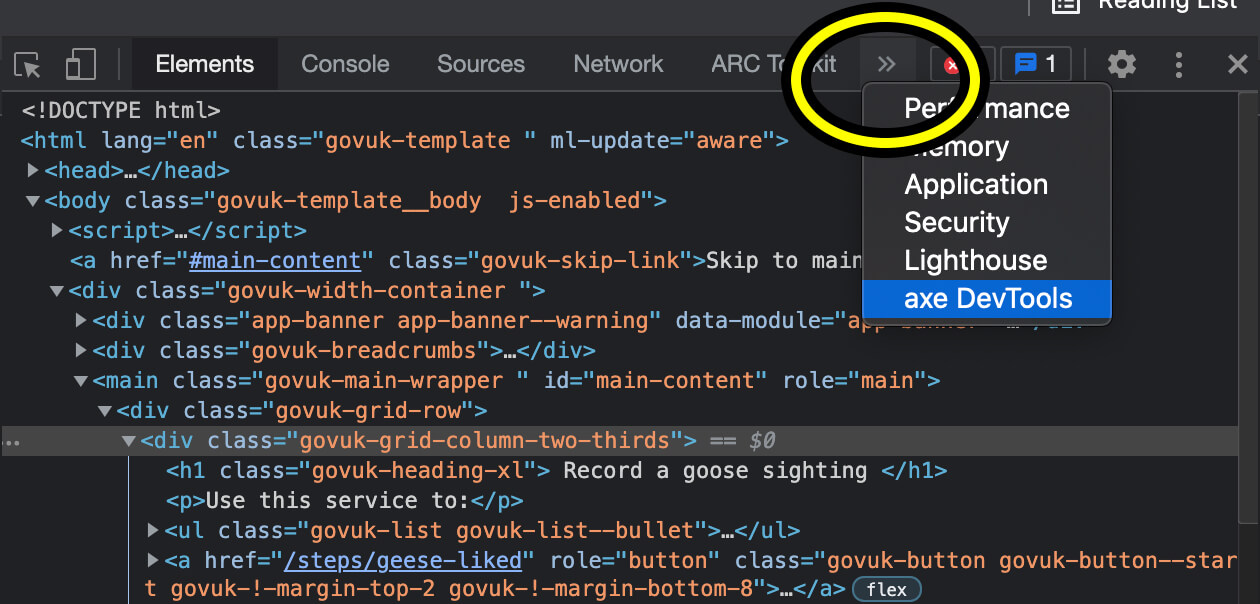
Chrome Dev Tools has options for Elements, Console, Sources etc. One of those options is ‘more tabs’ which is marked
by two small right facing arrows
>>. Choose the ‘more tabs’ option, and then choose ‘ARC Toolkit’.
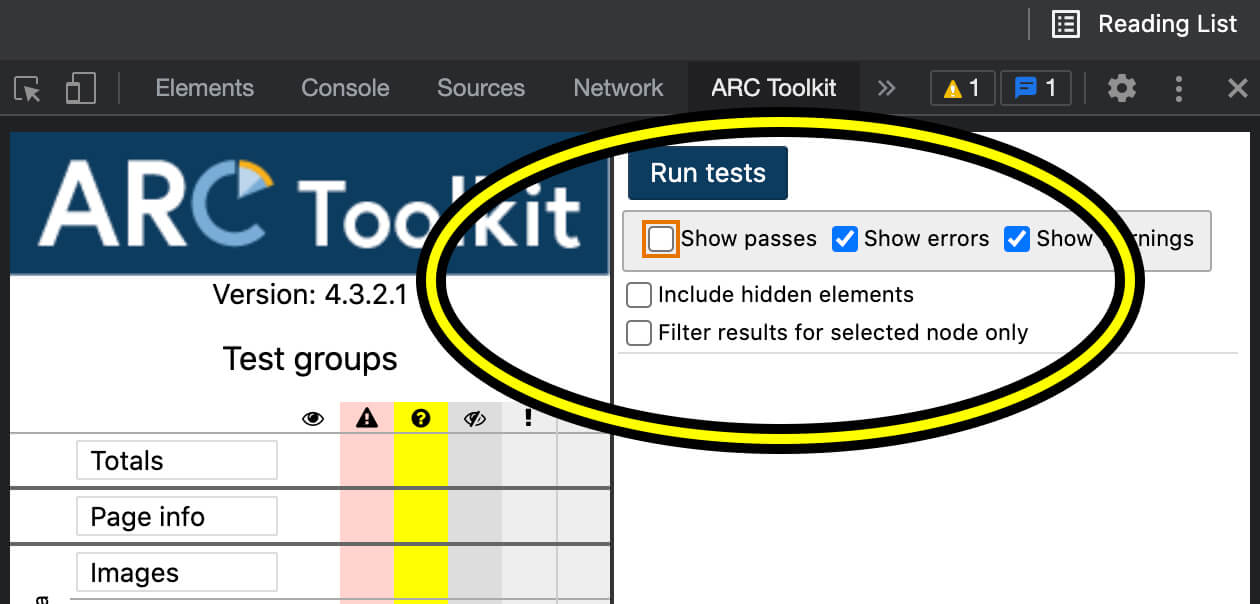
We are not really interested in what passes, we want to see what fails. So, uncheck the option for ‘show passes’. and choose ‘Run tests’.
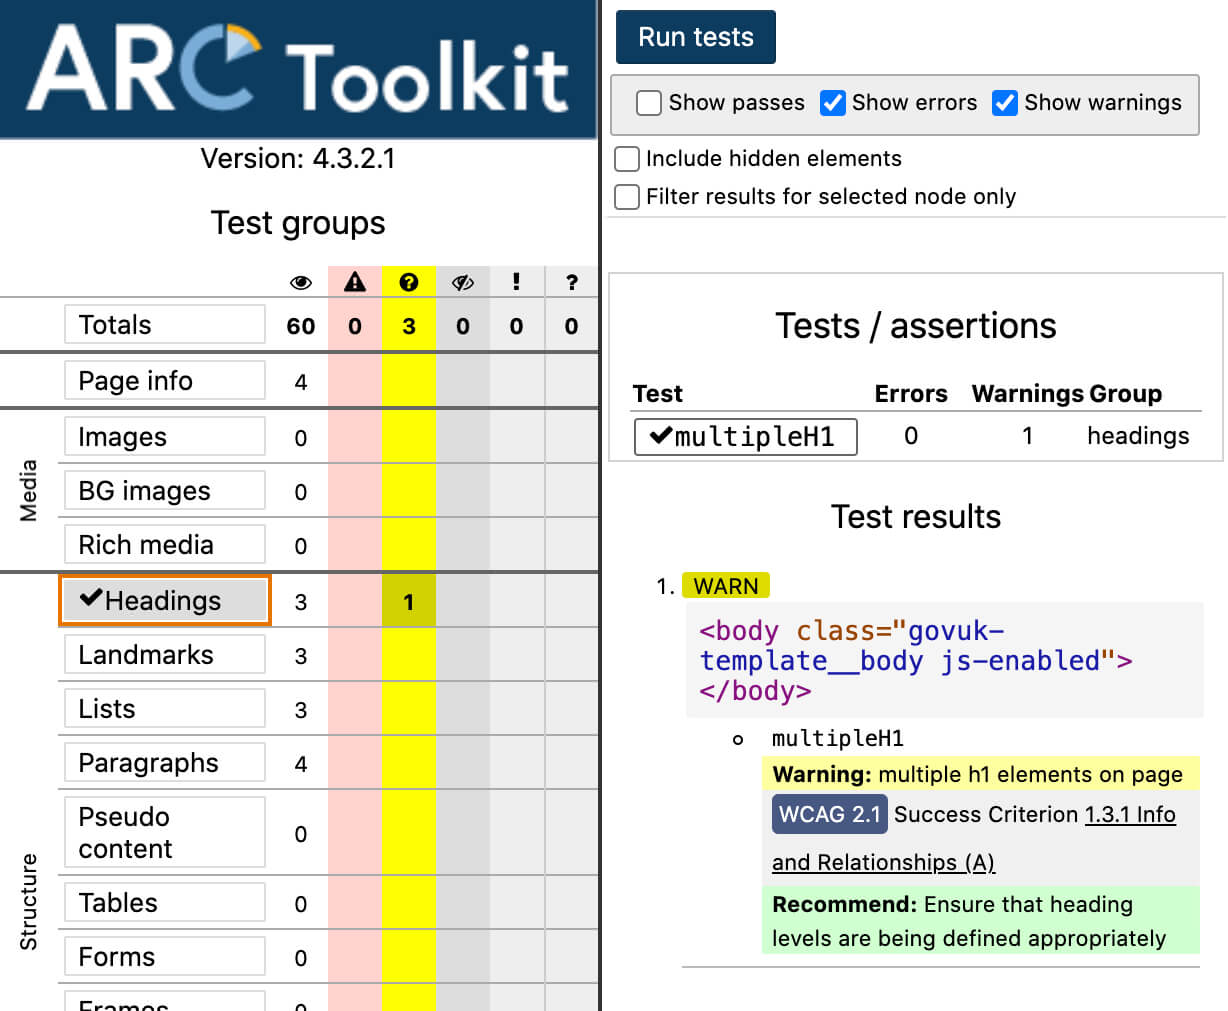
ARC Toolkit reports two types of issues, errors and warnings. Errors are what the tool has decided is definitely an
issue. Warnings mean the tool could not decide if it was definitely an error, so you must check it manually. Errors are
noted in the red column with the exclamation point
!
icon. Warnings are noted in the yellow column with the question mark
?.
Axe DevTools
Install Axe DevTools from the Chrome Web Store
Axe DevTools runs from the Chrome DevTools panel. Use
CMD + SHIFT + C
to open the Chrome Dev Tools. Alternatively you can right click on the page and choose ‘Inspect’.
Chrome Dev Tools has options for Elements, Console, Sources etc. One of those options is ‘more tabs’ which is marked
by two small right facing arrows
>>. Choose the ‘more tabs’ option, and then choose ‘axe DevTools’.
The first time you use Axe DevTools you will need to answer some questions. It is just analytics data for Deque to find out how their tool is being used.
Choose the ‘scan all of my page’ option to run the tests.
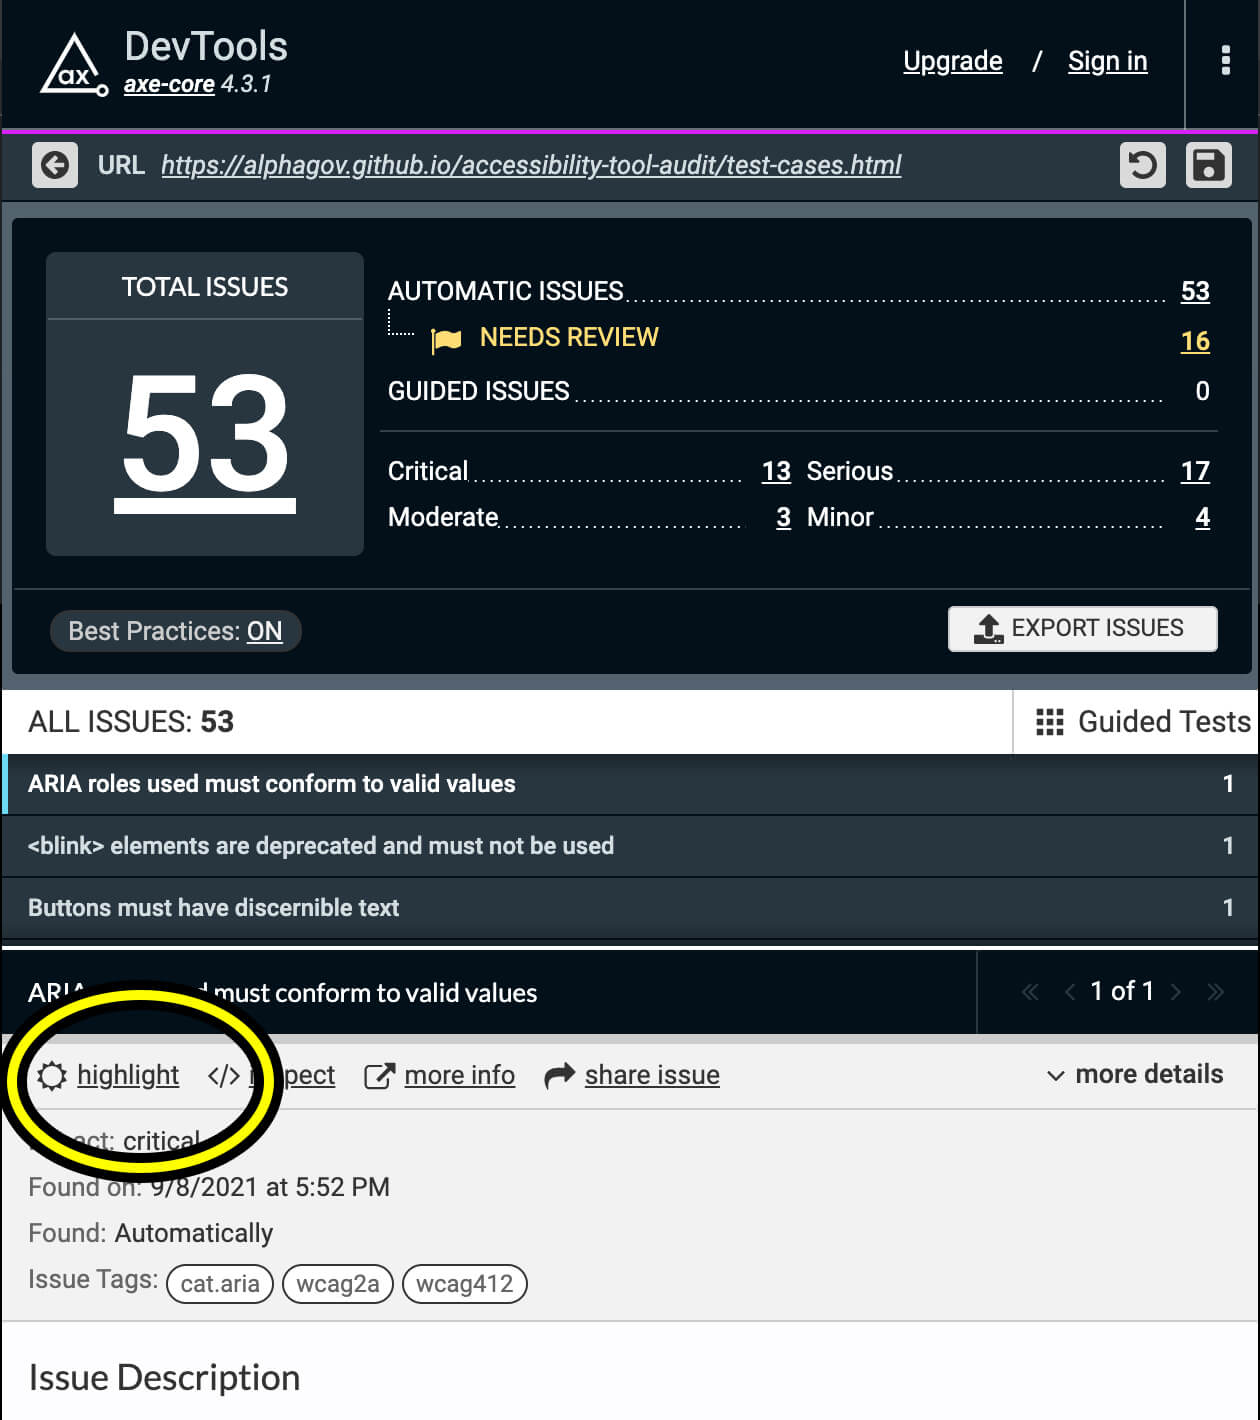
Axe DevTools reports two types of issues, automatic issues and needs review. Automatic issues are what the tool has decided is definitely an issue. Needs review means the tool could not decide if it was definitely an issue, so you must check it manually.
Turn on the ‘highlight’ option. This will add a visual indicator to show which element caused the issue. It makes it easier to understand where the problems are.
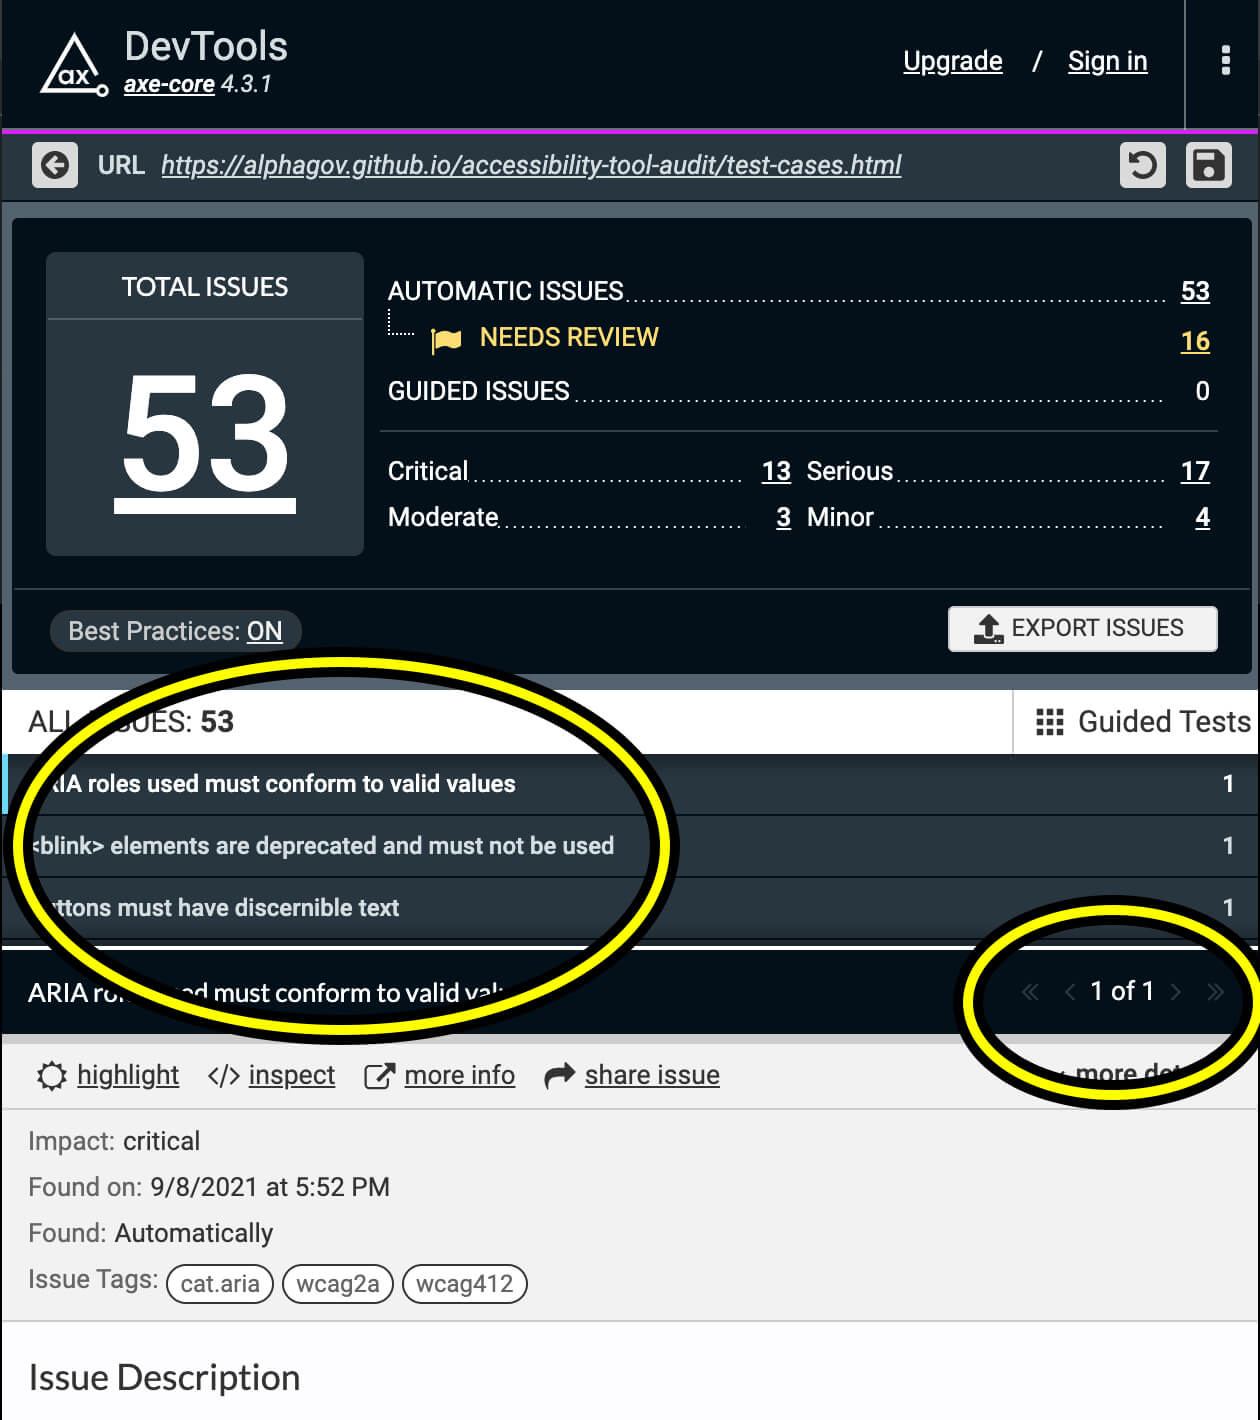
Choose each issue from the list. If there are more than one of the same issue, cycle through them using the pagination links.
Wave
Wave runs from the extension icon. Select it and wait for it to analyse the page.
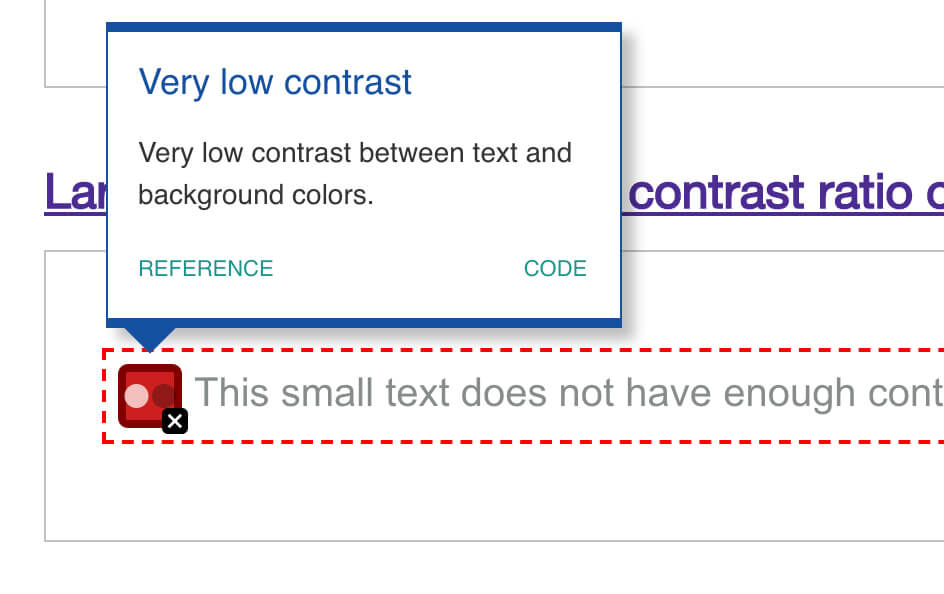
Wave reports 3 types of issues, errors, contrast errors and alerts. Contrast errors are errors relating solely to colour contrast. Errors are all the other errors the tool has decided are definitely an issue. Alerts means the tool could not decide if it was definitely an issue, so you must check it manually.
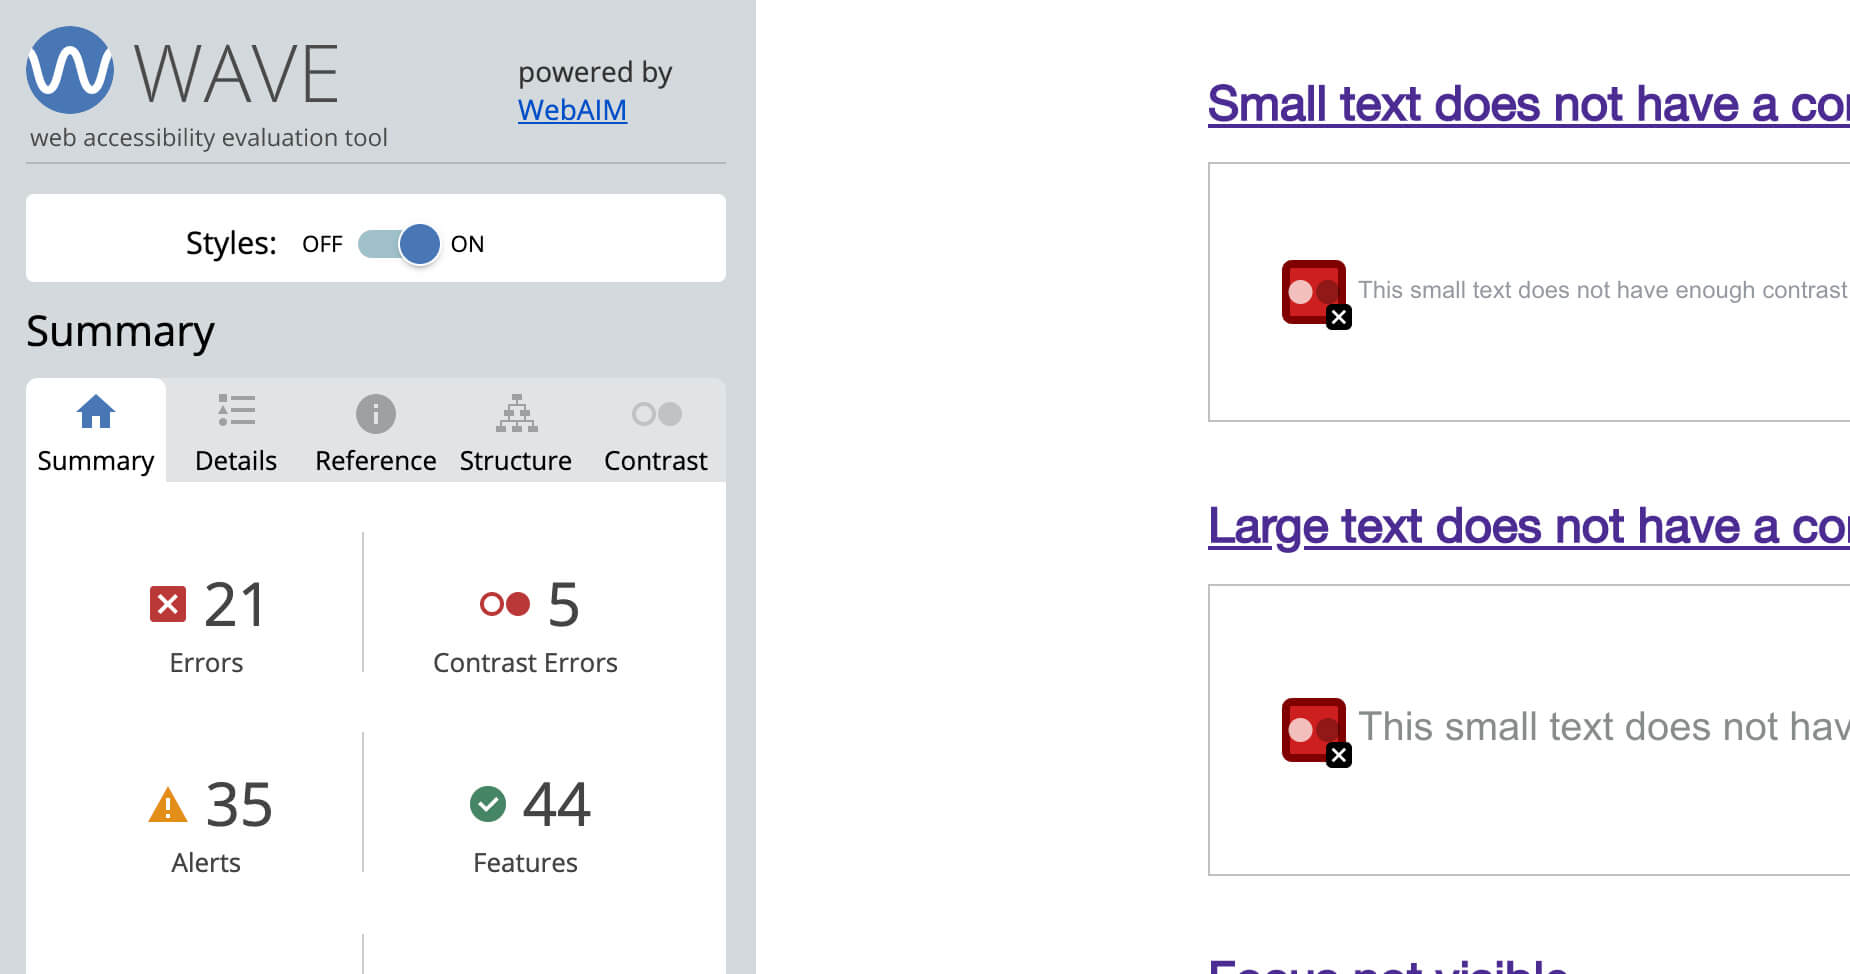
Wave also flags good structure and accessibility features. These can clutter the page and make it difficult to see where the problems are. So choose ‘details’ and then uncheck everything but the errors and alerts.
If an error is greyed out it means it is not visible on the page right now. For example a mobile menu might be hidden.
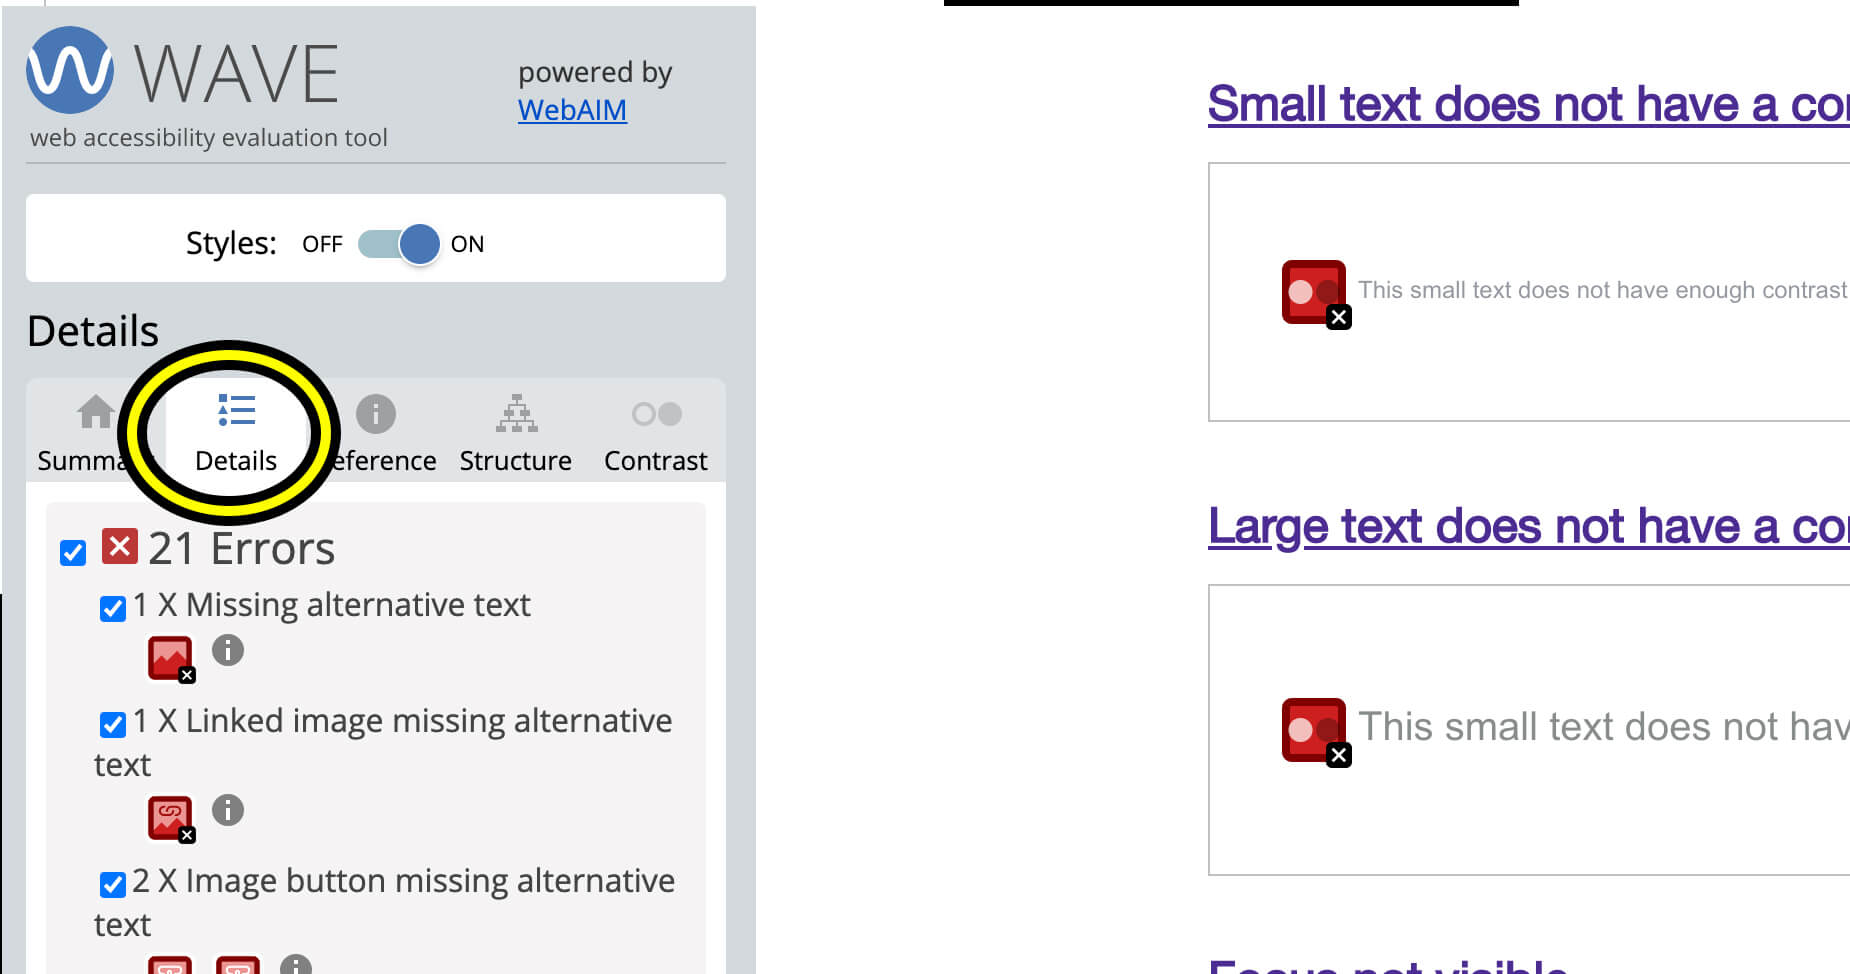
You can read the errors from the Wave panel or you can click on the overlays on the page to see which error they relate to.